Pipeline networks grow in size and complexity, but so do the risks of defects that come at a high cost. Traditional inspection and monitoring methods are insufficient to detect issues early on or prevent critical failures. Read on to explore how pipeline integrity management software (PIMS) enables oil and gas teams to identify, analyze, and prioritize defects in real time, providing predictive analytics, automated workflows, and high-quality maintenance.
A single undetected pipeline crack or corrosion incident might trigger a chain reaction of losses. It can shut down production, harm ecosystems, and expose oil and gas operators to enormous fines and reputational damage.
However, pipeline failures are far from rare. Here are several chilling facts about pipeline defects and their outcomes:
- In 2024 alone, incidents averaged 1.45 per day based on incomplete reporting, and the long-term average since 2010 remains close to 1.7 incidents daily.
- Since 2004, over 750,000 barrels of oil have been released into the environment.
- Regulatory penalties keep rising. The record $9.6 million fine proposed after a 2023 spill in the Gulf of Mexico could have been significantly reduced if risks had been identified earlier. Plus, this is just one example of an incredibly large fine, though not particularly significant, yet costly cases keep occurring regularly.
What do these numbers mean for oil and gas leaders? Reactive integrity management is no longer viable. In turn, early detection and data-driven defect analysis are becoming essential for business continuity, regulatory compliance, and trust. Read this article to discover how modern pipeline management systems can save the day, letting you spot and remove defects before they become critical.
What is a Pipeline Integrity Management System (PIMS)?
A Pipeline Integrity Management System (PIMS) is a comprehensive framework mostly used by oil and gas operators to guarantee safety, reliability, and compliance with regulatory standards throughout the pipeline’s lifespan. It mitigates the risks of corrosion, cracks, and other anomalies that compromise pipeline integrity, leading to spills, fines, or environmental harm.
A PIMS is not a plain database. Instead of just storing inspection records, it turns data into valuable insights, letting you reveal defects early, assess potential harm, and fix them proactively.
Pipeline management is a type of oil and gas software that uses multiple anomaly detection sources. It ingests data from in-line inspection (ILI) and sensor monitoring to historical performance, integrating, processing, and analyzing it. This approach is vital for pipeline integrity managers, engineers, asset integrity management (AIM) specialists, operations directors, and other decision-makers.
How Pipeline Management Software Identifies and Analyzes Defects?
Simply collecting and prioritizing inspection data isn’t enough to prevent pipeline failures effectively. Modern oil and gas operations use pipeline management software to transform this information into valuable insights, track the emerging threats, and eliminate them.
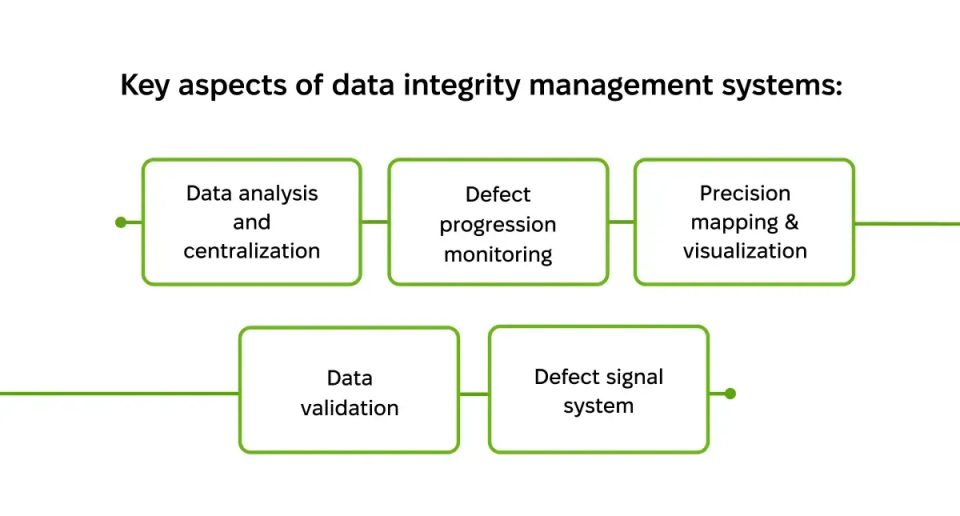
Let’s look at the most significant aspects of pipeline management systems and how they function to bring the expected results.
1. Integrating & Centralizing Inspection Data
One of the key reasons why it’s hard to detect defects early is fragmented, inconsistent data. While certain inspections and tools can be efficient, they don’t give you the full picture, as they remain separated across various systems, reports, and spreadsheets.
And here, pipeline management software steps in. It forms a single, centralized environment where oil and gas managers or operators inspect, monitor, and synchronize various insights.
But before the actual analysis begins, the platform collects and organizes three different streams of information. Let’s look at them in greater detail:
Automated Hardware Data
This data usually includes insights gathered by advanced tools, such as:
- In-Line Inspection (ILI), such as “smart pigs,” checks wall thickness, cracks, corrosion, and other defects.
- IoT sensors constantly monitor key indicators (pressure, temperature, structural stress, vibration, etc.)
- Drones and robotic inspections conduct external monitoring or reach pipeline sections inaccessible to humans.
Manual Inspection Data
This type of insight comes from field inspectors and engineers, who conduct visual inspections and take photos to collect evidence. Besides, they can classify defects, make maintenance notes, and more.
Contextual and Historical Data
To understand the nature and potential repeatability of defects, the system collects historical records, including previous inspection logs, maintenance and repair details, and third-party data (e.g., environmental factors such as temperature, weather, or soil conditions).
Separately, all this information may be too detached and incomplete. However, when assembled by convenient management software, it becomes a centralized selection of comprehensive, valuable insights.
2. Translating Raw Readings into Defect Signals
Even when centralized and combined, raw readings, logs, and inspection outputs can be useless unless you realize their value. That’s another challenge pipeline network specialists can solve with an efficient management platform. Powerful software translates the collected data into comprehensible indicators or signals. This way, operators and engineers unfold, prioritize, and respond to pipeline defect insights.
Here are several examples of how it works in practice:
Custom Algorithms
Custom analytical algorithms interpret physical behavior from digital signals. We at Exoft used this approach when working on advanced real-time monitoring software for one of our clients. Our team developed this system in collaboration with scientists and domain experts to make it as efficient as possible.
As a result, we provided unique custom features, allowing you to translate and convert certain parameters into assumptions of physical defects. For instance, pipeline wall thinning may indicate early-stage corrosion, while pressure drops or spikes often point out the risk of leaks or internal cracking.
Threshold Monitoring
Another advanced feature we developed for the same project was a custom alarm system. It ensures that asset managers are notified when a parameter exceeds its threshold. Color indicators deliver information regarding pipeline network health. In our case, yellow and red alerts warn of anomalies depending on the threat level. This way, the integrity and operations teams get timely notifications about affected pipeline segments and can analyze the root cause of the issue.
3. Precision Mapping and 3D Visualization
Pipeline defects are often hidden or difficult to access, making it much harder for field teams to locate and fix problems before they become critical. Robust PIMS solutions eliminate this challenge thanks to precision mapping and 3D visualization. These methods provide more accurate, compelling inspection reports.
Precision Mapping
A PIMS solution integrates GIS tools (like Google Maps or Mapbox) to visualize the entire pipeline network throughout the terrain. We at Exoft integrated this feature for a comprehensive oil & gas pipeline management solution.
Since our client needed a complex monitoring tool to assess the pipelines’ state and performance, we offered several effective deliverables, including a Google Maps integration. It visualizes pipelines on a map, where you can zoom in and explore each component to see how it functions. Thanks to this interactive feature, users can:
- Track anomalies by exact geolocation
- Understand how many miles of pipeline are actively operating at their peak
- Use this data for production scheduling and decision-making
3D Visualization with Digital Twins
Digital twins are interactive 3D representations of specific pipeline components. We designed this feature for the same PIMS project to let users visually examine pipelines and their separate components, including valves, flanges, vents, pipeline segments, and more. Every component comes with pop-ups providing details of its dimensions and conditions. Operators view the pipeline from different angles. Plus, with a pipeline visualization tool, you can zoom in, zoom out, rotate objects, and more.
4. Validating Data From Inspection Teams
No matter how advanced the analytics you use, it’s only efficient if the data behind them is reliable. Human errors, inconsistencies, and missing values often lead to poor decisions, which are costly when dealing with complex pipeline operations.
And again, PIM solutions come to the rescue. They enforce pipeline inspection data quality standards, ensuring that every log or record is accurate. Moreover, such solutions comply with the most important regulatory and internal requirements.
Here are several examples of how pipeline integrity management tools validate data.
Built-in Logic and Consistency Checks
The system automatically verifies incoming data to detect illogical or physically impossible entries. For example, it flags that a pipeline’s construction date is listed after its commissioning year, or pressure values exceed the pipe’s burst rating. When such anomalies occur, the solution reports them, letting operators check and remove inconsistencies.
Dynamic Inspection Forms
Consistent maintenance across teams, contractors, and operators dealing with pipeline networks is paramount. Integrity management platforms normally use dynamic digital forms standardized according to the inspected pipeline segment, the asset type, and regulatory standards. With predefined units and approved terminology, it’s easier to avoid inconsistencies and remove unnecessary guesswork.
5. Tracking Defect Progression & Predicting Their Occurrence
Oil and gas pipeline defects vary in form and nature, requiring robust data-driven solutions to spot and eliminate them. Advanced pipeline management platforms combine historical inspection data, real-time monitoring, and analytics, supporting efficient pipeline defect detection strategies and predictive maintenance for pipelines.
Here are some examples of how PIMS can monitor defect progression and predict incidents.
Defect Trending
Powerful analytical tools and data visualization techniques indicate the severity of particular problems, such as corrosion or decay. These include:
- Scatter plots to show clusters of anomalies
- Line graphs to track defect growth rates over time
- Heat maps to highlight high-risk pipeline zones
When working on the pipeline management platform, Exoft provided comprehensive data visualization, allowing end users to view, analyze, and process large amounts of information through clear charts, graphs, scatter plots, and more. As a result, the detection and estimation of oil & gas pipeline corrosion defects have become measurable, predictable, and actionable.
AI models
On a larger scale, advanced pipeline management systems use AI and machine learning models to predict where defects may occur and how soon they will exceed safe operating thresholds. Industry leaders, including Shell and Aramco, already apply predictive analytics to anticipate corrosion risks based on historical inspection data, sensor trends, and other insights.
Thanks to these approaches, operators can estimate:
- The likelihood of defect formation
- The probability of threshold exceedance
- The need for insulation, welding, corrosion repair, or part replacement
Thus, teams plan maintenance windows, schedule downtime, and warn stakeholders about possible challenges.
Need to catch pipeline defects earlier?
The whitepaper explains how software supports inspection data, anomaly mapping, and integrity planning.
Why the Investment in Pipeline Integrity Management Systems Pays Off
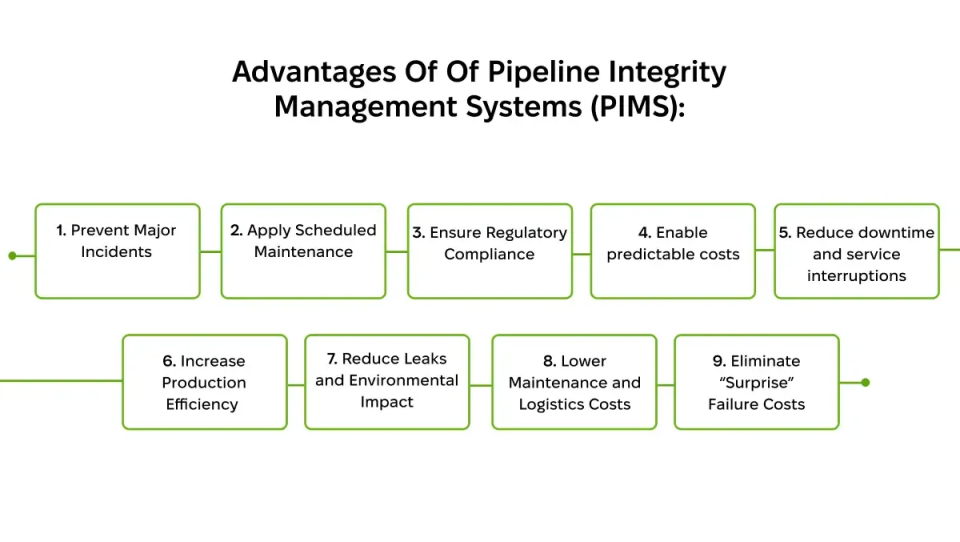
As you can see, pipeline integrity management software brings numerous compelling benefits, including measurable operational, financial, and safety returns. Here is a summary of the key reasons why a PIMS is a worthy investment for oil and gas businesses.
- Prevent major incidents. Detect defects before they escalate.
- Improve field team safety. Apply scheduled maintenance instead of emergency response, which often comes with severe outcomes.
- Ensure regulatory compliance. Adhere to global industry standards, including DNV, API 1160, and ASME B31.8S.
- Enable predictable costs. Plan defect mitigation instead of reacting to failures.
- Reduce downtime and service interruptions. Avoid unplanned shutdowns and cutouts.
- Increase production efficiency. Boost your entire pipeline network.
- Reduce leaks and environmental impact. Address risks before they escalate.
- Lower maintenance and logistics costs. Conduct planned repairs and extend asset lifecycle.
- Eliminate “surprise” failure costs. Let budgets shift from emergency repairs to new investments and growth initiatives.
Develop a Pipeline Integrity Management System vs Buy a Ready-Made Solution
When planning to build a pipeline integrity management system (PIMS), companies usually choose between buying an off-the-shelf solution and developing a custom platform. Each approach has its pros and cons in terms of cost, speed, flexibility, and long-term scalability.
Let’s review the benefits and downsides of each solution to help you pick the right model, considering your pipeline network, operational specifics, and business objectives.
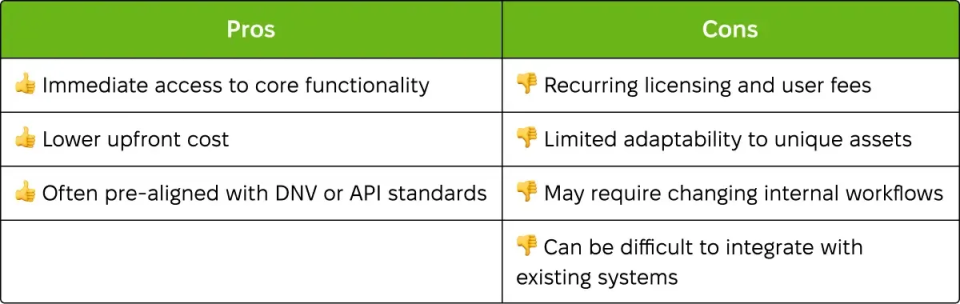
Buying a Ready-Made PIMS
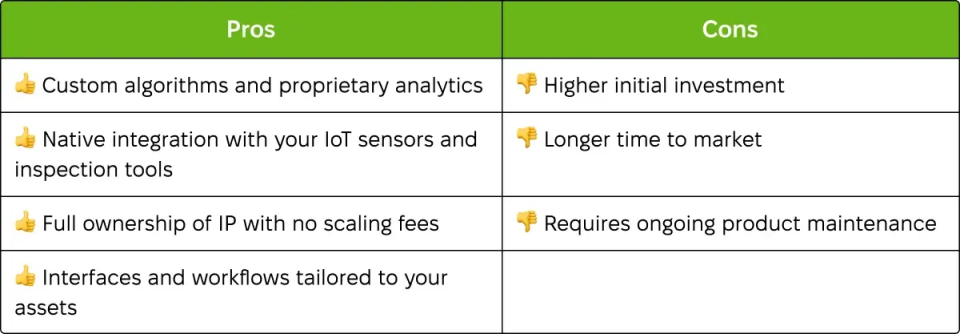
Developing a Custom PIMS
Conclusion
Looking to build a custom solution for result-driven pipeline management or modernise the existing platform? We at Exoft are here for you with our oil and gas software development services!
Our rich portfolio comprises successful projects for major US and Saudi oil and gas companies, including pipeline monitoring systems, ESP monitoring software, and digital oilfield solutions.
Thanks to these long-term partnerships, we understand the industry’s pressures: downtime is costly, defects often develop gradually, and compliance is a must. That’s why we focus on stable and reliable monitoring solutions, building cutting-edge tools, like AI, digital twins, and custom data visualization, where they truly add value.
Get in touch to get a solution for your specific case, be it custom software development, data engineering and visualization, legacy modernization, or cross-integration. Let’s discuss your pipeline monitoring needs and explore what’s best for your business!