Oil well output is bound to decline due to natural causes, but you can slow down the rate of that decline by closing operational gaps. In this guide, Exoft’s experts break down how poor data visibility, reactive maintenance, and other inefficiencies can lead to unplanned downtime and missed deviations from the decline curve. Read on to explore the five software solutions that will help you close each of these operational gaps.
No matter what you do, oil well decline is inevitable. While you can’t fight Mother Nature, you can influence how fast the decline happens and how it affects your oil production. But, of course, that requires investment. In fact, since 2019, 90% of annual upstream investment has been used to offset the decline.
But, according to the International Energy Agency, it’s working. If all capital investment in well performance optimization were to stop, the agency estimates that global oil production would decline by 8% a year.
Well Decline 101: Definition, Rates, and Natural Causes
Before we dive into one of the solutions to the oil well decline problem, let’s recap why it happens in the first place. Simply put, wells rely on pressure to drive oil to the surface. That pressure lessens over time, which is the main reason why any oil well is bound to decline.
Decline happens in phases, with the observed decline curve being gentler than the natural one, thanks to capital investments:
- Phase 1: Below 85% of the peak level
- Phase 2: 50% of the peak level
- Phase 3: Below 5% of the peak level
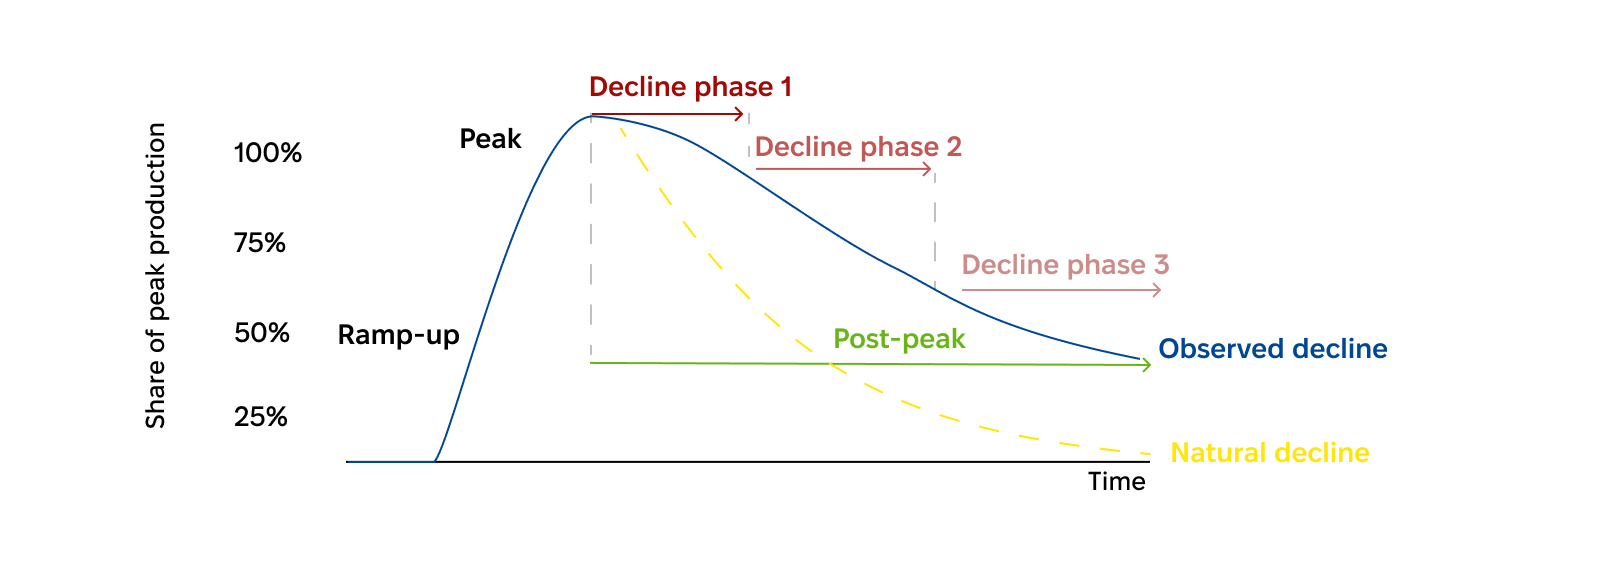
Source: IEA, The Implications of Oil and Gas Field Decline Rates
On average, conventional oil well production declines by 5.6% a year after reaching its peak. Among conventional wells, the oil well decline rate is higher for shallow offshore (8.5%) and deep and ultradeep offshore (10.3%) wells than for their onshore counterparts (4.2%).
The Physics Behind the Oil Well Decline
Basic physics can explain why well performance inevitably declines over time. We’ve already mentioned the underground pressure dropping as a main cause, which means:
- The well loses the force required to push fluids upwards
- Pumps may get damaged if the dissolved gas escapes from the oil
In offshore oil production, water also gradually fills the space left after oil extraction. So, pumps capture more water and less oil over time.
Geology Plays a Role, Too
These geological characteristics of the reservoir may also accelerate or slow down the production decline:
- Reservoir size. Larger reservoirs can maintain higher pressure longer, slowing down the decline as a result.
- Porosity and permeability. These two characteristics determine how much oil the rock can hold and how easily fluids move through it. Low permeability, for example, leads to higher natural decline rates (over 35% in the first year for tight oil wells).
- Rock composition, depth, and temperature. These characteristics determine fluid viscosity, flow rates, and gas behavior. For example, lower temperatures increase oil viscosity, making it more difficult to keep it flowing.
Operational Gaps: The Decline Factor You Can Actually Control
If the observed drop in production comes faster or is greater than what the decline curve analysis predicted, don’t shrug it off as a natural order of things. These five operational gaps can also be the reason why oil wells underperform, not physics or geology.
Poor Data Visibility
Oil wells produce terabytes of data every single day, with estimates ranging from 1.5 TB to 10 TB a day. A single 3D seismic survey adds 5 to 10 TB of raw data, with the figure rising to over one petabyte for 4D and ultra-deepwater surveys.
Without analytics that can handle these data volumes and user-friendly dashboards to make insights easily accessible, issues go unnoticed. Yes, even though the data to indicate them is right there.
Manual Workflows
If employees spend their time reconciling data, running calculations for curve analysis, or pinpointing deviations, it takes them longer to identify an issue and take action to resolve it. Besides, that’s not an insignificant portion of time wasted: one study estimates that up to 40% of management time is spent on manual data coordination.
Fragmented Data Formats
A single oil well site can work with a vast variety of data: reservoir models, drilling and log data, wellbore shape models, seismic and sensor data, etc. Some data may come in proprietary formats (e.g., reservoir models) and require conversion. Fragmented data equals incomplete input for analytics, which skews its results.
Disconnected Systems
If data can’t flow automatically between applications, it either remains siloed or requires manual data entry. The first scenario effectively stands in the way of analytics, while the second extends time-to-insight.
The result? You may either miss production issues entirely or catch them too late.
Reactive Maintenance
Reactive maintenance leads to costly disruptions, higher emergency repair costs, lower equipment lifespan, and increased safety risks. Proactive maintenance, powered by sensor data and real-time predictive analytics, in turn, can prevent up to 40% of equipment failures.
Early Detection: Why It Makes Financial Sense
Downtime is costly across industries, but it’s especially expensive — and more unpredictable — in the oil industry.
For one, the cost of downtime is directly linked to oil prices. In other words, the more expensive the oil, the costlier an hour of downtime. For example, a 2022 Siemens report put the price of unplanned downtime at $500,000 an hour. The company’s 2024 report, however, stated that an hour of downtime cost roughly the same in 2023 as it did in 2019.
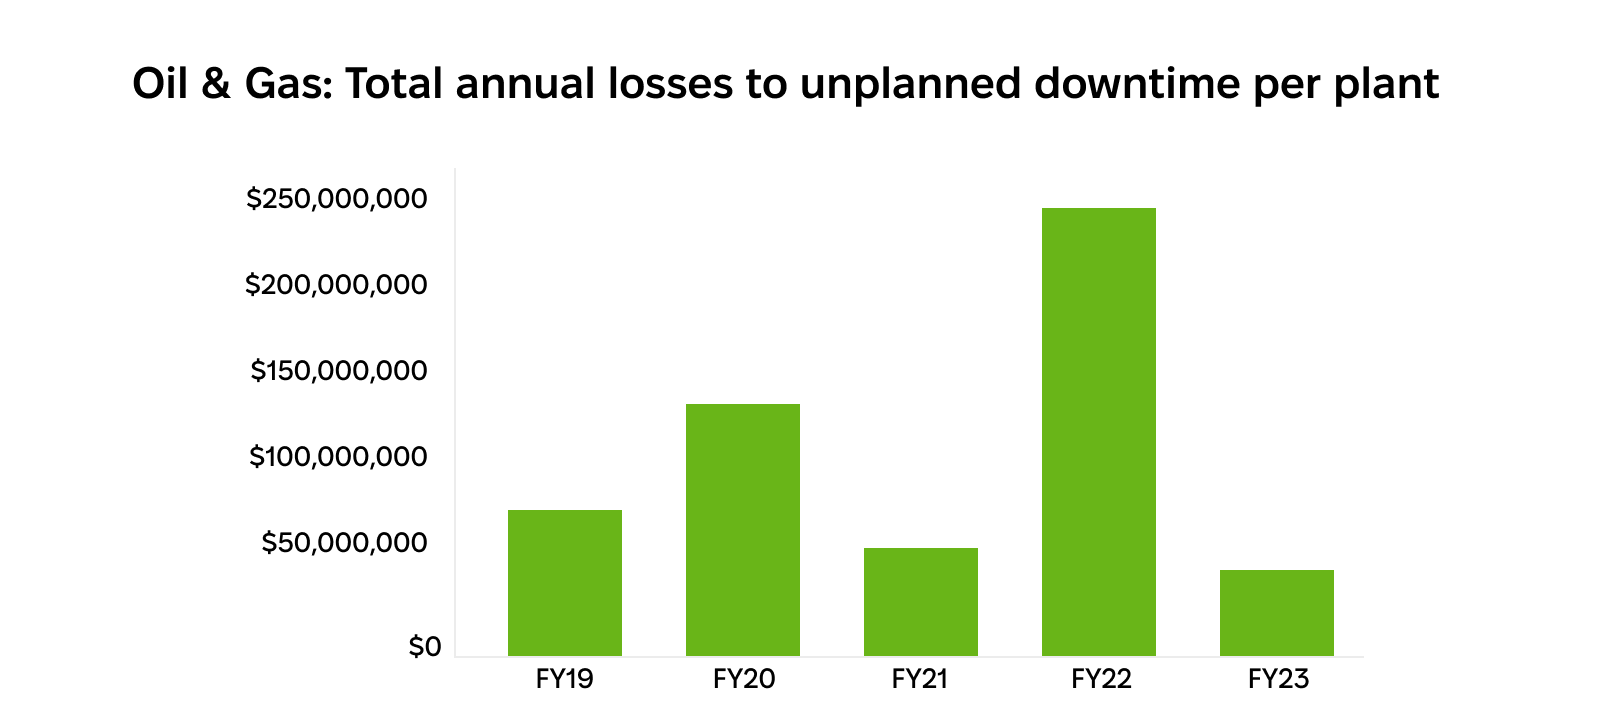
Source: Siemens, Total annual losses due to unplanned downtime in oil and gas, per plant, 2019-2023
Needless to say, the March-April 2026 events in the Middle East drove up oil prices — and reminded everyone how volatile they can be. The current price of downtime would therefore be comparable with that of 2022.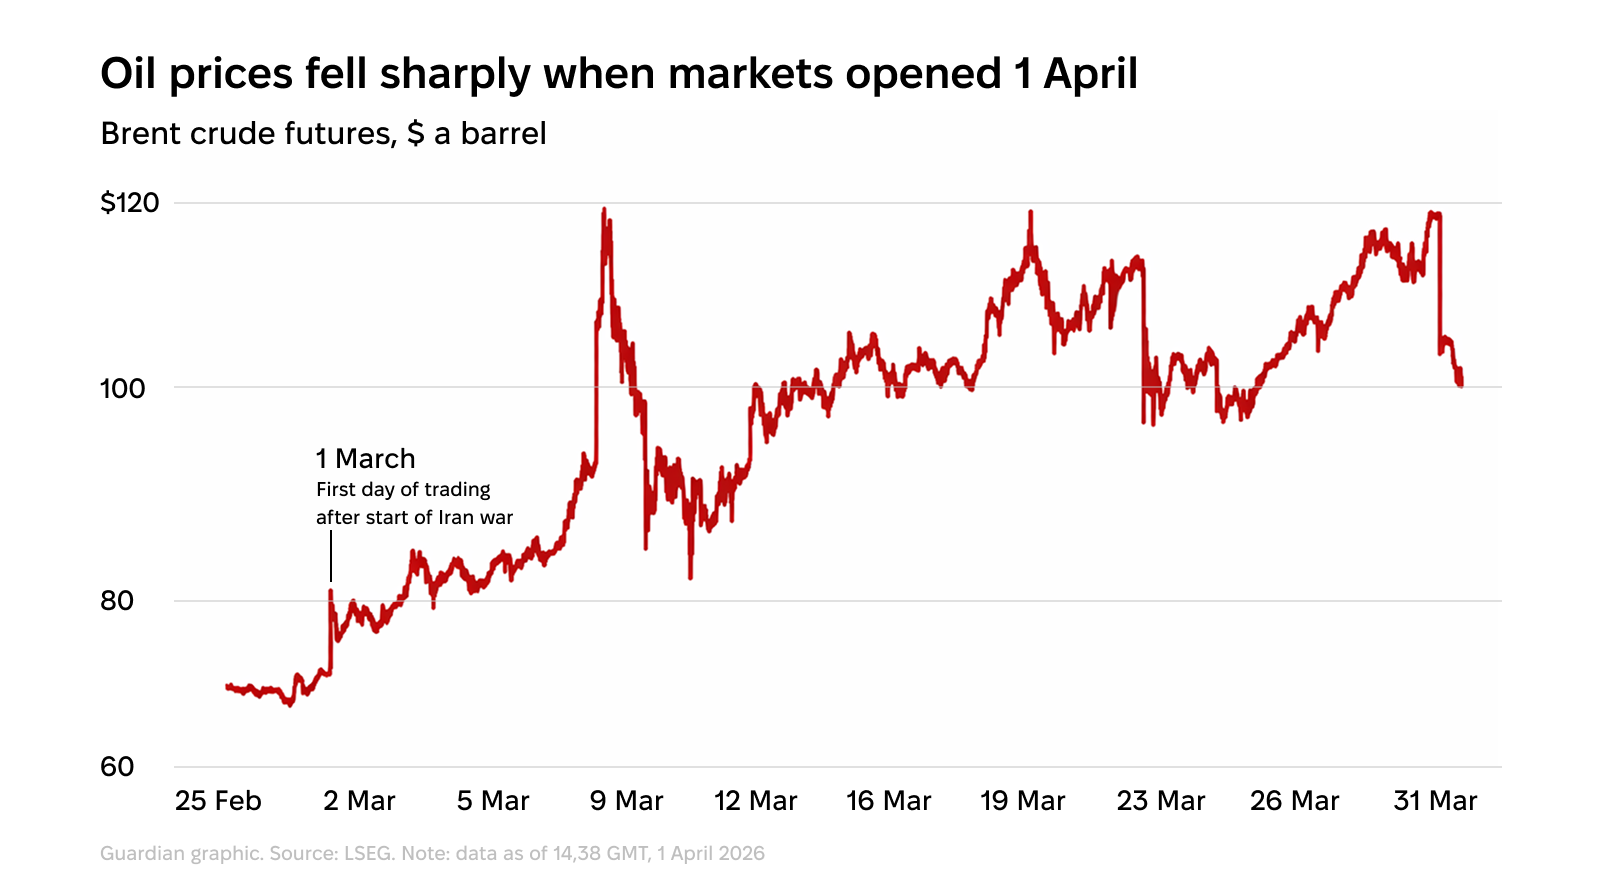
Source: Oil price fluctuations after the start of the Iran war, 2026
Half a million dollars per hour. That’s how much a single unnoticed pressure drop or pump malfunction at one site can cost you. For companies operating hundreds of wells, missed deviations across the portfolio can quickly end up costing millions a year.
That makes real-time monitoring, predictive analytics, and data-driven optimization the highest-ROI digital investments in oil and gas. For example, proactive maintenance can prevent up to 140 hours of downtime a year. At $500,000/hour, that equals up to $70 millions in cost savings.
But preventing downtime isn’t the only quantifiable benefit of implementing these technologies. Leveraging digital oilfield solutions can bring down the cost per barrel by $3 and unlock $275 billion in value from operations optimization, according to some estimates. Real-time monitoring and optimization, in turn, can increase production yield by 10% to 15% a year.
How Software Helps Reduce Well Decline Rate
Real-time monitoring and production optimization software in oil and gas can address each of the operational gaps we discussed earlier. Here’s how to reduce the well decline rate with specific solutions for specific issues.
Real-Time Dashboards
Operational gap addressed: Poor data visibility
Bringing all oilfield production monitoring data into a single database won’t be enough to address poor visibility. You have to make that data easy to grasp for all user groups (production engineers, maintenance teams, inspection engineers, etc.).
So, consolidate sensor, SCADA, and inspection records in user-friendly, intuitive dashboards with real-time data visualizations. Make them accessible in low-connectivity environments and on mobile devices.
Automated Curve Analysis and Deviation Alerts
Operational gap addressed: Manual workflows
Reservoir, drilling, and production engineers need to quickly identify how operational events impact well performance. Oil well performance analysis software, one of the essentials for oil and gas companies, can alert them to deviations in well performance.
Using machine learning, this software can run performance analysis using real-time and historical production data. It will also flag the tiniest of deviations — before they cost you thousands or millions.
Unified Data Platform
Operational gap addressed: Disconnected systems
The variety of systems in place isn’t a problem per se: each tool is designed to serve a distinct purpose, and do it well. What matters is how well you connect them.
To bring all that data together to run analytics or visualize it, you’ll need a unified data platform. Make sure it can work with all types of data (structured, unstructured, semi-structured) and support large volumes.
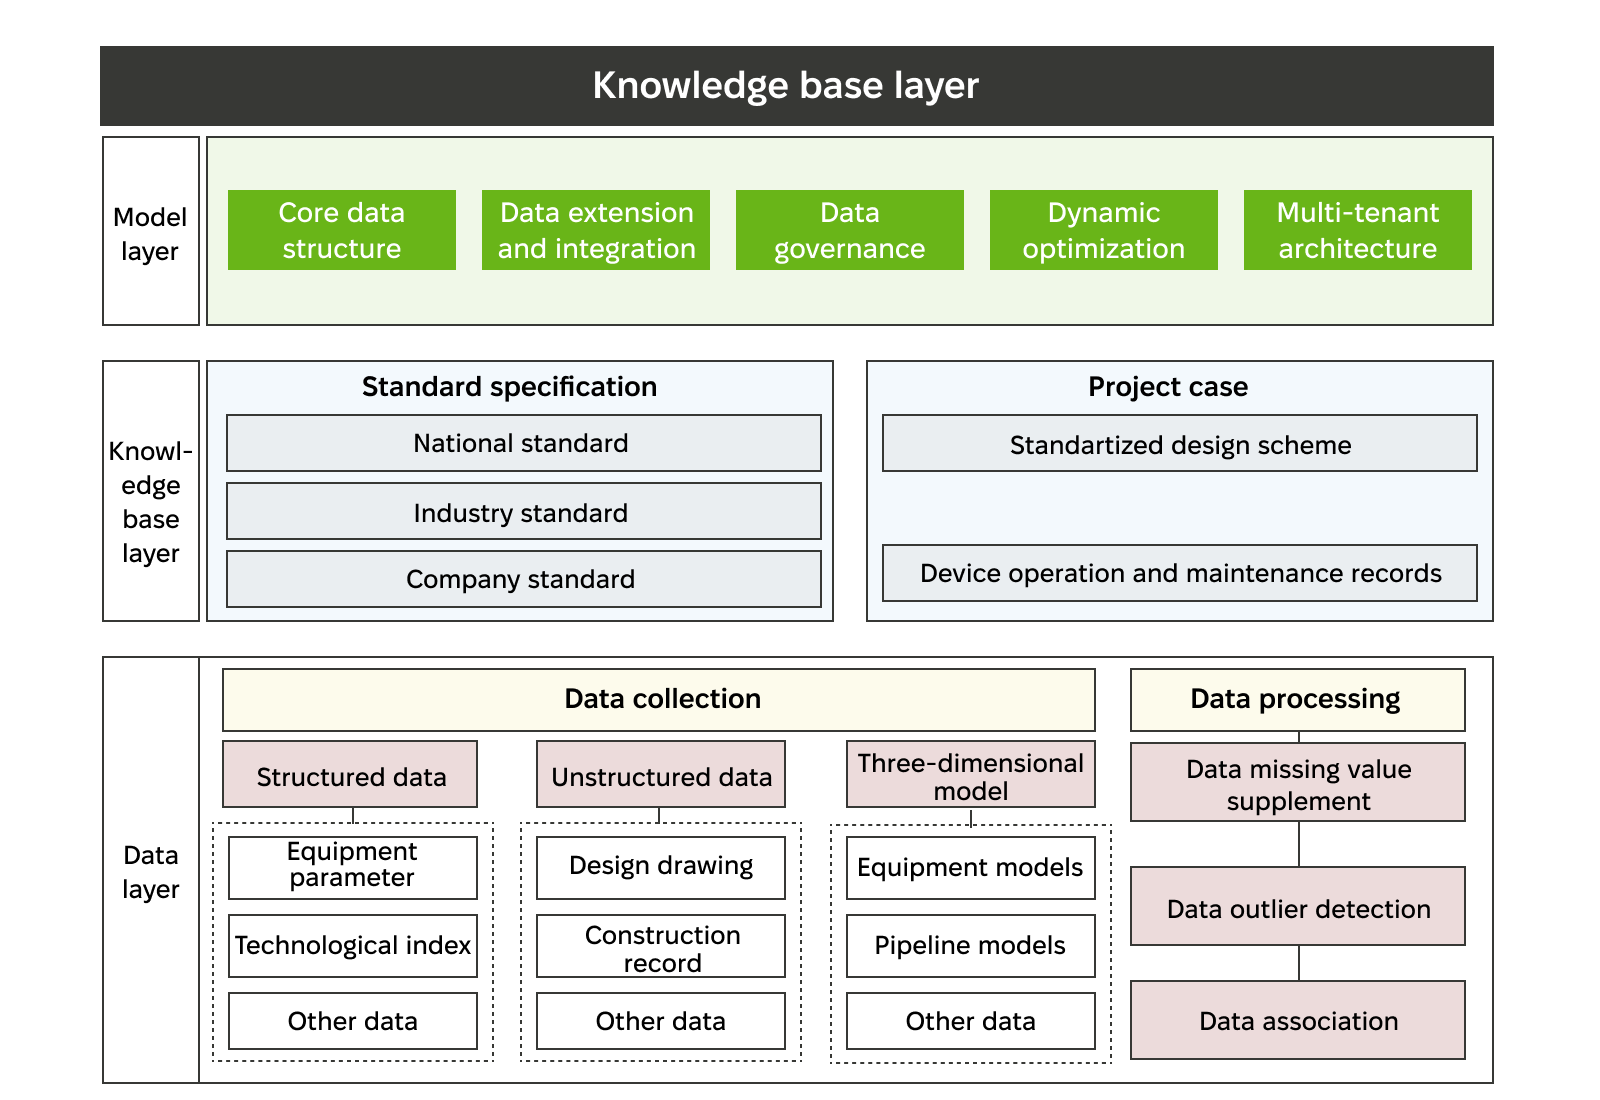
Source: MDPI, An example of the unified data platform architecture for oil companies
ETL Pipelines
Operational gap addressed: Fragmented data formats
Extract, Transform, and Load (ETL) processes, as the name suggests, collect, preprocess, and integrate data into the data platform.
The Transform part of the pipeline is crucial for well data management. When data comes in diverse formats, it helps standardize those data points, validate them, remove duplicates, and prepare data for further analytics.
Equipment Monitoring and Condition-Based Alerts
Operational gap addressed: Reactive maintenance
Real-time equipment health stats with condition-based alerts will let maintenance teams know when to intervene, before a failure even occurs. For example, monitoring software for electrical submersible pumps and artificial lifts collects real-time pressure, vibration, voltage, and other data to that end.
Combined with historical inspection and failure data, the monitoring software can catch early signs of trouble and alert the team. Those signs can include rising motor temperatures, abnormal voltage, or excessive vibration, to name a few.
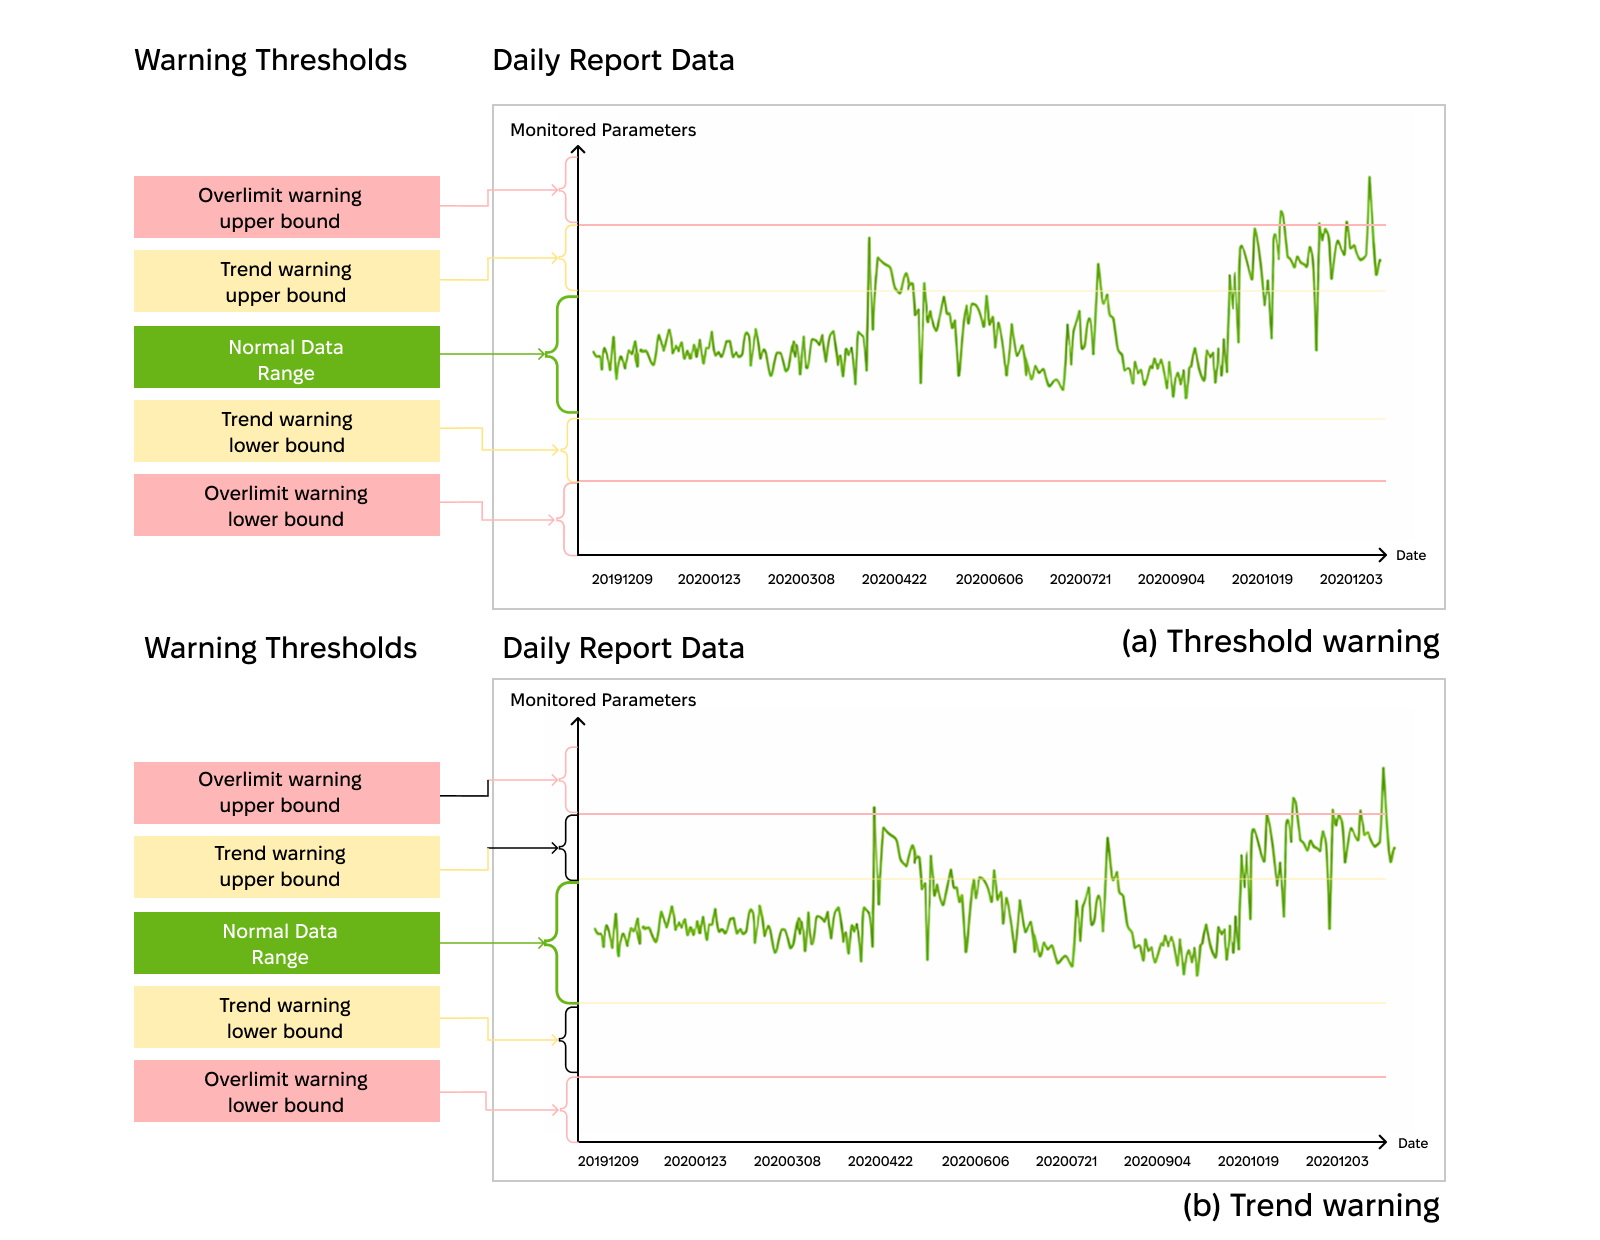
Source: MDPI, An example of trend warning for a monitored production parameter
Prevent downtime and extend equipment lifetime with Exoft’s oilfield production software.
What This Looks Like in Practice
If you want to learn more about the benefits of well data management software, look no further than Exoft’s own experience with a leading European digital oilfield vendor. The company turned to us with a request to build a comprehensive solution that would:
- Make working with large databases easy for users
- Visualize cross-location data in a single dashboard
- Enable secure video and voice communication
Exoft went beyond coding and testing. Our team also helped the client refine the product vision, define specs, and iterate through multiple prototypes. As a result of our involvement, our client secured a competitive edge with a solution that:
- Simplifies data management with advanced visualization and intuitive user flows
- Streamlines workflows with bottleneck identification for core processes
- Secures internal communication for well workers to protect confidential information
Conclusion
Nothing can prevent oil well decline altogether. Yet, how fast it happens is still within your control. Slowing it down is a matter of operational choices regarding data visibility, reactive vs proactive maintenance, and so on.
For the past decade, Exoft has been helping oil and gas industry players eliminate operational inefficiencies with targeted software solutions. Don’t know where to start with well performance optimization? Get in touch with us to discuss your operational challenges.
Frequently asked questions
-
What causes oil wells to stop producing?
Oil well output continuously declines because, as pressure drops, it becomes harder for the fluid to travel upward. Reservoir size and rock porosity, permeability, composition, depth, and temperature can slow down or speed up the decline.
-
How long does an oil well typically produce?
An oil well's lifespan is measured in decades. For example, about a quarter of oil fields still in operation are more than 50 years old, and another quarter is between 20 and 50 years old.
-
How do you detect early signs of well underperformance?
Pinpointing early deviations from the decline curve can help catch and fix operational problems that cause underperformance. That requires real-time production data collection and analytics, automated decline curve analysis, and deviation alerts.
-
What does well performance monitoring software actually do?
Well performance monitoring software collects multiple production data points, such as drilling fluid composition, completion data, and fluid temperature and pressure. It visualizes these indicators in user-friendly dashboards for well workers. It also sends out alerts whenever a specific indicator deviates from the norm.
-
What data sources does well performance software typically integrate?
Well performance software collects data from IoT sensors in the equipment (e.g., pumps) or throughout the site (e.g., air quality), as well as data from the SCADA system and inspection records.
-
When should oil and gas operators invest in well performance software?
The telltale signs you need to invest in well performance software include: high downtime, faster-than-predicted decline, and low ROI. This software will help you catch deviations from the decline curve, fix underlying issues, and prevent asset failures.